28 August 2019
Results for the six months ended 30 June 2019
- Solid operational performance in all our businesses
- Business performance net profit (1)(2) of US$154 million
- Reported net profit (2) of US$139 million
- New order intake (3) of US$2.0 billion year to date
- Net cash of US$69 million
- Interim dividend of 12.7 US cents per share
| Six months ended 30 June 2019 | Six months ended 30 June 2018* | ||||
US$m | Business performance | Exceptional items and certain re-measurements | Total | Business performance | Exceptional items and certain re-measurements | Total |
Revenue | 2,821 | - | 2,821 | 2,785 | - | 2,785 |
EBITDA | 305 | n/a | n/a | 334 | n/a | n/a |
Net profit/(loss) (2) | 154 | (15) | 139 | 191 | (208) | (17) |
* Re-presented due to the reclassification of an item from exceptional items and certain re-measurements to business performance as set out in note 6 to the interim condensed consolidated financial statements.
Ayman Asfari, Petrofac’s Group Chief Executive, commented:
“Petrofac has delivered good results that reflect solid operational performance across the business.
“New order intake year to date has been impacted by recent challenges in Saudi Arabia and Iraq. Looking forward, the Group has a busy tendering pipeline with around US$13 billion of bid opportunities due for award in the second half of the year.
“We remain committed to our strategy of delivering best-in-class execution for our clients and enhancing returns for our shareholders by reducing costs, driving digitalisation, increasing local content, improving cash conversion and divesting non-core assets. These ongoing initiatives will improve our competitiveness in core and growth markets, as well as best position the business for a return to growth in the medium-term.”
DIVISIONAL HIGHLIGHTS
Engineering & Construction (E&C) (4)
Solid results reflecting project phasing and mix
- US$1.6 billion of new order intake year to date, including awards in Algeria, Oman and the Netherlands
- Steady progress delivering our portfolio of projects
- RAPID project ready for start-up
- Central island handover on Upper Zakum Field Development
- Jazan North tank farm and Fadhili projects nearing mechanical completion
- Pre-commissioning activities well progressed on KNPC Clean Fuels project
- Water introduced into the Lower Fars Heavy Oil plant
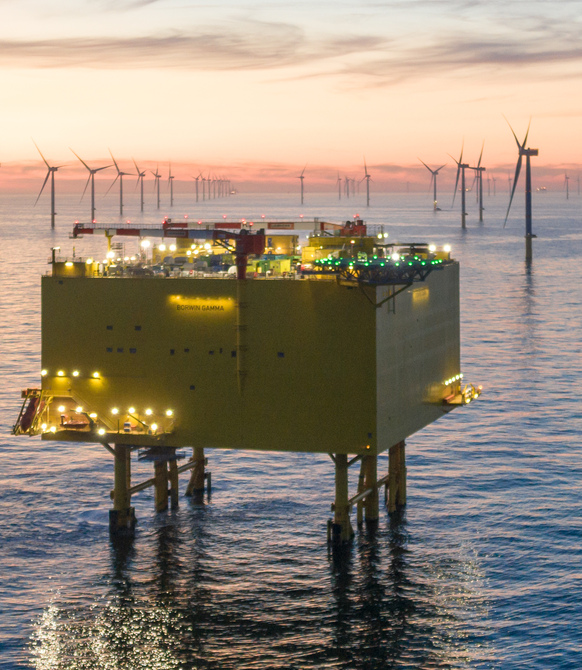
- Power transmission commenced from BorWin 3 offshore grid connection project in North Sea
- Al Taweelah Alumina Refinery started up
- Rabab Harweel Integrated Project commenced gas production
- Revenue up 2% to US$2.3 billion, principally reflecting project phasing and variation orders
- Net margin down 1.4 ppts to 6.5%, driven by project mix, cost overruns and higher tax
- Net profit down 16% to US$148 million
Engineering & Production Services (EPS) (4)
Strong growth in Projects offset by a decline in margins
- US$0.4 billion of awards year to date, predominantly in the UK, Oman, UAE and Iraq
- Revenue of US$0.4 billion, up 4% driven by strong growth in Projects
- Net margin down 1.2 ppts to 5.1% reflecting a decline in contract margins, higher overheads and higher tax
- Net profit down 15% to US$23 million
Integrated Energy Services (IES)
Good growth in underlying profitability
- Revenue of US$99 million, down 27% (up 5% excluding asset sales)
- Higher average realised price (5) of US$69/boe (1H 2018: US$56/boe)
- Equity production up 8% to 1.0 mmboe (net) excluding asset sales
- Lower PEC tariff income and cost recovery
- EBITDA down 19% to US$58 million (up 31% excluding asset sales)
- Higher contribution from equity production excluding asset sales
- Lower net cost recovery from Magallanes and Arenque PECs
- Increase in associate income
- Net profit down 56% to US$7 million (up 147% excluding asset sales)
Exceptionals and certain re-measurements
The reported net profit of US$139 million (2018: US$17 million net loss) was impacted by exceptional items and certain re-measurements of US$15 million (2018 re-presented: US$208 million) largely relating to Group reorganisation and redundancy costs, SFO related legal fees and JSD6000 disposal costs.
NET CASH AND LIQUIDITY
Net cash was US$69 million at 30 June 2019 (31 December 2018: US$90 million net cash), reflecting better than expected working capital inflows at the period end, the phasing of tax and dividend payments, and the purchase of the Company’s shares by the Employee Benefit Trust. Free cash flow was US$123 million (30 June 2018: US$126 million outflow). The Group retained strong liquidity of US$1.8 billion at 30 June 2019 (31 December 2018: US$1.9 billion) following the repayment and retirement of US$0.2 billion of facilities during the period.
DIVIDEND
The Board has declared an interim dividend of 12.7 US cents per share (2018: 12.7 US cents). The interim dividend will be paid on 18 October 2019 to eligible shareholders on the register at 20 September 2019 (the ‘record date’). Shareholders who have not elected to receive dividends in US dollars will receive a sterling equivalent. Shareholders can elect by close of business on the record date to change their dividend currency election.
OUTLOOK
We remain well positioned for the remainder of the year, with backlog of US$8.6 billion at 30 June 2019 (31 December 2018: US$9.6 billion) and US$2.6 billion of secured revenue for the second half of 2019.
Backlog (4)(6) | 30 June 2019 | 31 December 2018 |
| US$ billion | US$ billion |
Engineering & Construction | 7.3 | 8.0 |
Engineering & Production Services | 1.3 | 1.6 |
Group | 8.6 | 9.6 |
|
|
|
We continue to expect Engineering & Construction results for the full year to be in line with management guidance, with revenues expected to be around US$4.5 billion and net margins at the low end of guidance. Overall Group profitability in 2019 is expected to be first half weighted, principally reflecting a decline in EPS margins and lower oil prices in the second half. Looking further forward, revenues are expected to decrease in 2020 reflecting low new order intake in recent years.
In line with the Group’s strategy, we continue to target best-in-class delivery for our clients and to maintain our competitive advantage. The Group has a busy tendering pipeline with around US$13 billion of bid opportunities due for award in the second half of the year. The strength of our pipeline is indicative of the improving market outlook. Consequently, the Group is committed to invest in maintaining bench strength and technical capability in anticipation of a return to growth in the medium-term.
We are also committed to maintaining a strong balance sheet and capital discipline. Group capital expenditure is expected to be around US$125 million in 2019 (2018: US$98 million). We are reviewing options for our remaining non-core assets, consistent with our strategic objective to enhance returns.
SFO INVESTIGATION
No charges have been brought against Petrofac, or any officers or current employees. Petrofac continues to engage with the SFO and will respond to any further developments as appropriate. We are focused on bringing this matter to closure as quickly as possible and believe this is in the best interests of all stakeholders.
NOTES
- Business performance before exceptional items & certain re-measurements. This measurement is shown by Petrofac as a means of measuring underlying business performance.
- Attributable to Petrofac Limited shareholders.
- New order intake comprises new contract awards and extensions, net variation orders and the rolling increment attributable to EPS contracts which extend beyond five years.
- On 1 January 2019, the engineering, procurement and construction management (EPCm) business was reclassified from EPS to E&C. The EPCm business is presented within E&C in prior period comparative figures.
- Average net realised price is net of royalties and hedging gains or losses. It is based on sales volumes, which may differ from production due to under/over-lifting in the period.
- Backlog consists of: the estimated revenue attributable to the uncompleted portion of Engineering & Construction division projects; and, for the Engineering & Production Services division, the estimated revenue attributable to the lesser of the remaining term of the contract and five years.
View the Group's financial statements for the six months ended 30 June 2019.
PRESENTATION
Our half year results presentation will be held at 9.30am today and will be webcast live via:
https://webcast.merchantcantoscdn.com/webcaster/dyn/4000/7464/16532/115796/Lobby/default.htm
ENDS
Disclaimer:
This announcement contains forward-looking statements relating to the business, financial performance and results of Petrofac and the industry in which Petrofac operates. These statements may be identified by words such as “expect”, “believe”, “estimate”, “plan”, “target”, or “forecast” and similar expressions, or by their context. These statements are based on current knowledge and assumptions and involve risks and uncertainties. Various factors could cause actual future results, performance or events to differ materially from those described in these statements and neither Petrofac nor any other person accepts any responsibility for the accuracy of the opinions expressed in this presentation or the underlying assumptions. No obligation is assumed to update any forward-looking statements.


